Requirements
Tools
Getting Started with Sysmon
Sysmon Overview
Sysmon is a Windows system service and device driver that, once installed on a system, remains resident across system reboots to monitor and log system activity to the Windows event log. In contrast to common Antivirus/HIDS solutions, Sysmon performs system activity deep monitoring, and log high-confidence indicators of advanced attacks. Sysmon is using a device driver and a service that is running in the background and loads very early in the boot process. [Source]
Sysmon Tags and Events
ID
|
Tag
|
Event
|
1
|
ProcessCreate
|
Process Create
|
2
|
FileCreateTime
|
File creation
time
|
3
|
NetworkConnect
|
Network
connection detected
|
4
|
n/a
|
Sysmon service
state change (cannot be filtered)
|
5
|
ProcessTerminate
|
Process
terminated
|
6
|
DriverLoad
|
Driver Loaded
|
7
|
ImageLoad
|
Image loaded
|
8
|
CreateRemoteThread
|
CreateRemoteThread
detected
|
9
|
RawAccessRead
|
RawAccessRead
detected
|
10
|
ProcessAccess
|
Process
accessed
|
11
|
FileCreate
|
File created
|
12
|
RegistryEvent
|
Registry object
added or deleted
|
13
|
RegistryEvent
|
Registry value
set
|
14
|
RegistryEvent
|
Registry object
renamed
|
15
|
FileCreateStreamHash
|
File stream
created
|
16
|
n/a
|
Sysmon
configuration change (cannot be filtered)
|
17
|
PipeEvent
|
Named pipe
created
|
18
|
PipeEvent
|
Named pipe
connected
|
Sysmon XML Conditions
Condition
|
Description
|
Is |
Default, values
are equals
|
is not
|
Values are
different
|
Contains
|
The field
contains this value
|
Excludes
|
The field does
not contain this value
|
begin with
|
The field
begins with this value
|
end with
|
The field ends
with this value
|
less than
|
Lexicographical
comparison is less than zero
|
more than
|
Lexicographical
comparison is more than zero
|
Image
|
Match an image
path (full path or only image name). For example: lsass.exe will match
c:\windows\system32\lsass.exe
|
Great Sysmon Use Cases
- BotConf2016 Advanced Incident Detection and Threat Hunting using Sysmon (and Splunk) Tom Ueltschi 2016 (Slides)
- BotConf2016 Advanced Incident Detection and Threat Hunting using Sysmon (and Splunk) Tom Ueltschi 2016 (Video)
- Microsoft Sysmon Deployment 2017 - Dimitris Margaritis (slides)
- Splunkmon - Takin Sysmon to the Next Level (Whitepaper)
- Posh-Sysmon Module for Creating Sysmon Configuration Files 2017(Article)
- How to Go from Responding to Hunting with Sysinternals Sysmon RSAC 2017 (Slides)
- Hunting with Sysmon - Michael Haag 2017 (Article)
- Sysmon-dfir - Michael Haggis (Github)
- Sysinternals Sysmon unleashed (Article)
- SwiftOnSecurity - Sysmon Config 2017 (Github)
- Explaining and adapting Tay's Sysmon Configuration (Article)
Installing Sysmon
I had already installed Sysmon V5 in my systems, but with a recent update from Mark Russinovich, I needed to update a few images, and content in this post.
 |
| Figure 1. Sysmon V6 FYI release. |
To get started download Sysmon V6 from here.
 |
| Figure 2. Sysmon V6 Download page. |
Extract contents of the zipped file to a preferred directory.
 |
| Figure 3. Extracting files to tools directory. |
Launch cmd.exe as administrator, navigate to the folder where sysmon was extracted to, and if you want to know what sysmon can do just type:
sysmon.exe /?
 |
| Figure 4. Sysmon Menu. |
We can go ahead and try a basic installation by running the following command:
sysmon.exe -i -accepteula -h md5,sha256,imphash -l -n
- - i : Install Service and driver. Optionally take a configuration file.
- -h : Specify the hash algorithms used for image identifications
- -l : Log loading of modules. Optionally take a list of processes to track
- -n : Log network connections
 |
| Figure 5. Installing Sysmon. |
Now, if we run Eventviewer as administrator and browse to Applications and Services Logs > Microsoft > Windows > Sysmon > Operational, you will see that Sysmon is already working and generating logs as shown in figure 6 below.
 |
| Figure 6. Sysmon Logs. |
You can also view the configuration which Sysmon is running on by typing:
sysmon.exe -c
 |
| Figure 7. Current Configuration. |
How do we update our current configuration and apply rules to it?
sysmon.exe -c Your_custom_config.xml
You can use my StartLogging.xml config as a basic first script to start. This script has several Event IDs set to Log everything, and this is because I want you to tune it your way.. I just had a few exclusions already set there specially for Event IDs 1, 3, 6, 7, 10, 11, 12,13,14 to help you a little bit with filtering some initial noise.
Lets update our current config and apply our StartLogging.xml configuration.
 |
| Figure 8. Updating current configuration and showing it on console. |
You will not see many logs being generated, but that will change as soon as you start testing a few things. We have not set up our winlogbeat data shipper, but I will highly recommend to turn winlogbeat services off until you tune your sysmon configuration so that it captures the main anomalies from the attack you are executing. Once you are comfortable with your sysmon config, turn on your winlogbeat service and you will be able to see the events in your Kibana dashboard.
This can be a good time to take a snapshot on your endpoints with Sysmon installed.
Getting started with Winlogbeat
Stay in the windows computer where you set up Sysmon. To get started, download Winlogbeat from here and copy the unzipped folder to C:\Program Files\ as indicated by the Getting Started Winlogbeat Guide.
 |
| Figure 9. Winlogbeat Download page. |
 |
| Figure 10. Save the zipped file to your drive. |
 |
| Figure 11. Winlogbeat folder unzipped. |
 |
| Figure 12. Copying winlogbeat folder to indicated location. |
 |
| Figure 13. Winlogbeat folder copied to C:\Program Files\ . |
Open PowerShell as administrator, navigate to the winlogbeat folder contents and run the install-winlogbeat-service.ps1 powershell script.
.\install-winlogbeat-service.ps1
 |
| Figure 14. Run PowerShell as administrator. |
 |
| Figure 15. Navigate to your winlogbeats folder. |
 |
| Figure 16. Running install-service-winlogbeat.ps1 script. Also, using Run Once option. |
Next, run notepad as administrator. This will allow us to edit the winlogbeat config file and saving it without having "access denied" warning messages. Once notepad is open, open the winlogbeat.yml file in your winlogbeat folder.
 |
| Figure 17. Opening notepad as administrator. |
 |
| Figure 18. Opening winlogbeat.yml file in notepad. |
You will now be able to edit what log types it collects. We will add the following line after - name: System
Add: - name: Microsoft-windows-sysmon/operational
 |
| Figure 19. Original first part of the winlogbeat config. |
 |
| Figure 20. Adding Sysmon Logs to the configuration. |
Next, you can see that elasticsearch by default is configured to be the output to use when sending the data collected by the beat. We are going to change that by doing the following:
Add a # sign before Output.elasticsearch (as shown in figure 22)
Add a # sign before hosts: ["localhost:9200"] (as shown in figure 22 below)
 |
| Figure 21. Original Elasticsearch output configuration. |
 |
| Figure 22. Adding # signs to the Elasticsearch output section to disable the output. |
Now, it is time to configure the Logstash Output of the winlogbeat configuration. As you can see, we can set up the certificate that we created in our Ubuntu server in our previous post. We are going to make some changes to this part, but first make sure you have your cert created as shown in figure 24 below. If you did not create the certificate and private key in the previous host, I recommend to go back to it and do it before we continue.
 |
| Figure 23. Original Logstash Output section. |
 |
| Figure 24. Making sure cert exists in our ELK server. |
Use PSCP.exe to retrieve the certificate from the ELK server. Make sure SSH services are running in your ELK server before doing this. You can download PSCP.exe as part of a Putty bundle from here.
 |
| Figure 25. PSCP.exe to retrieve certificate from ELK server via SSH. |
Once you are ready run the following:
.\PSCP.EXE <username>@<IP of you ELK>:/etc/pki/tls/certs/logstash-forwarder.crt C:\<anywhere in your windows system>
 |
| Figure 26. Copying certificate from ELK to your Windows computer. |
 |
| Figure 27. Certificate was copied successfully. |
Now, back in our Logstash output section, do the following:
- Delete the # signs from Output.logstash (as shown in figure 28)
- Delete the # signs from hosts: ["Your ELK IP address:5044"] (as shown in figure 28)
- Delete the # signs from ssl.certificate_authorities: ['C:\<wherever you copied your cert to'] (as shown in figure 28)
 |
| Figure 28. Logstash configured to be the default output. |
Test your winlogbeat config by running:
.\winlogbeat.exe -c .\winlogbeat.yml -configtest -e
 |
| Figure 29. Config OK. |
Finally, you will have to start the winlogbeat service. You can use your PowerShell to do it by typing:
start-service winlogbeat
 |
| Figure 30. Starting the winlogbeat service. |
 |
| Figure 31. Starting the winlogbeat service. |
 |
| Figure 32. The winlogbeat service started successfully. . |
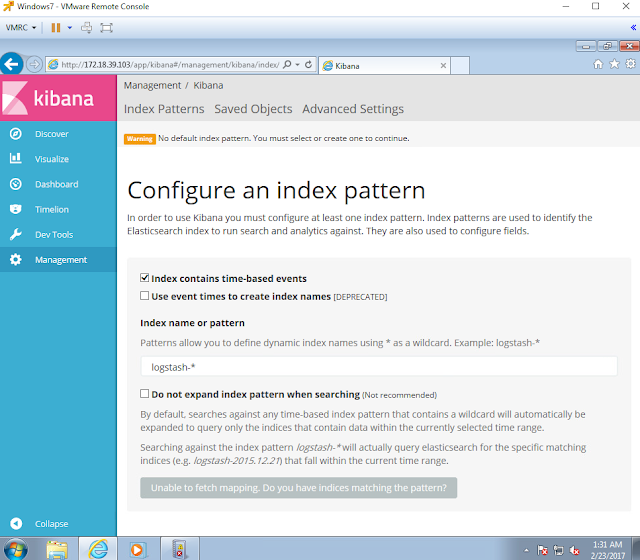
Next, open your favorite browser and go to your ELK's IP address. You will be able to substitute logstatsh-* for winlogbeat-* and set the field name to Timestamp as shown in figure 33 below. Click on the create option at the bottom to continue.
 |
| Figure 33. Index Pattern configuration. |
 |
| Figure 34. Index Pattern configuration. |
You will be prompt to see how your winlogbeat-* index is storing the logs hitting your ELK. Next, on the left panel options, click on Discover to look at your logs.
 |
| Figure 35. Winlogbeat index. |
 |
| Figure 36. Searching for logs. |
 |
| Figure 37. Logs made it to our ELK stack. |
Below your Winlogbeat-* index, you can actually hover the data fields and click on the option add. You will be able to add as many fields as you want making it easier to read the logs.
 |
| Figure 38. Adding fields to our discover view. |
WOW! We made it! We have officially finished setting up our basic threat hunting lab. Remember, this is just the beginning. There are so many things that you can add to this lab setup, but I will leave that to your imagination and your own research.
Now, the one million dollar question,
HOW DO I USE ALL THIS TO START TRAINING MY HUNTING SKILLS?
I will give you a sneak peek of what I will do in my next series "Chronicles of a Threat Hunter" with a basic example:
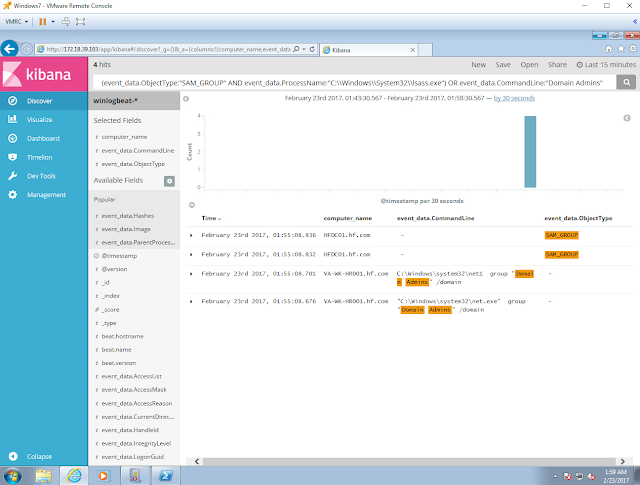
Hunting for users in the network interrogating AD to know who the Domain Admins are
 |
| Figure 39. Net.exe interrogating our AD for Domain Admin users. |
Query:
(event_data.ObjectType:"SAM_GROUP" AND event_data:ProcessName:"C:\\Windows\\System32\\lsass.exe") OR event_data.CommandLine:"Domain Admins"
 |
| Figure 40. Hunting for the HUNTER :) . |
That's it, and I hope you found this series helpful to start setting up your own lab. Let me know how this works out for you. #SharingIsCaring
LET THE HUNT BEGIN!
Feedback is greatly appreciated! Thank you.