Pages

Sunday, March 26, 2017

Chronicles of a Threat Hunter: Hunting for WMImplant with Sysmon and ELK - Part I (EID 1,12, 13, 17 & 18)


It was a normal day at work when all of the sudden I see the following on Twitter 


Apparently this new WMI RAT runs perfectly fine on Device Guard-enabled systems! It was Game ON ! I got very excited to test this tool BUT only to see how I could hunt for it, of course. Even though there might be different ways to detect the behavior of this new tool, I decided to use the tools I have been playing with for the past couple of months, Sysmon & ELK. 


Requirements:


  • Sysmon Installed (I have version 6 installed)
  • Winlogbeat forwarding logs to an ELK Server
  • An ELK Stack set up (I recommend reading this and this to help you set up your environment)
  • A Kibana Dashboard (I recommend reading this post to understand how you can create a dashboard in Kibana with Sysmon Logs)
  • WMImplant Script
  • Two Windows 7+ VMs (Victim & Attacker)
  • Notepad ++ (Good to edit Sysmon configs)


What is WMImplant?


WMImplant is a PowerShell based tool developed by @christruncer that leverages WMI to both perform actions against targeted machines, but also as the C2 channel for issuing commands and receiving results. WMImplant will likely require local administrator permissions on the targeted machine.  It is designed to run both interactively and non-interactively. When using WMImplant interactively, it’s designed to have a menu of commands reminiscent of Meterpreter. [Source]


Getting ready to hunt for WMImplant


Getting a Sysmon Config ready


The main goal is to log for only logs related to WMIimplant and filter out all the noise. It is easy to say "Just log for WmiPrvSE.exe activity in your Sysmon config" or "read the source code to know what you can log for". However, I find it more interesting, easier and faster to filter out most of the normal activity in my gold image and then look for the abnormal. Then, you could reference the code to understand your findings (it is up to you how you approach this part). I used my StartLogging.xml sysmon config which I used as a basic first config to filter out noise on an initial Sysmon setup.


Download and save the Sysmon config in a preferred location of your choice. Then, update your Sysmon rules configuration. In order to do this, make sure you run cmd.exe as administrator, and update your Sysmon rules with the configuration you just downloaded by running the following commands:


Sysmon.exe -c [Sysmon config xml file]


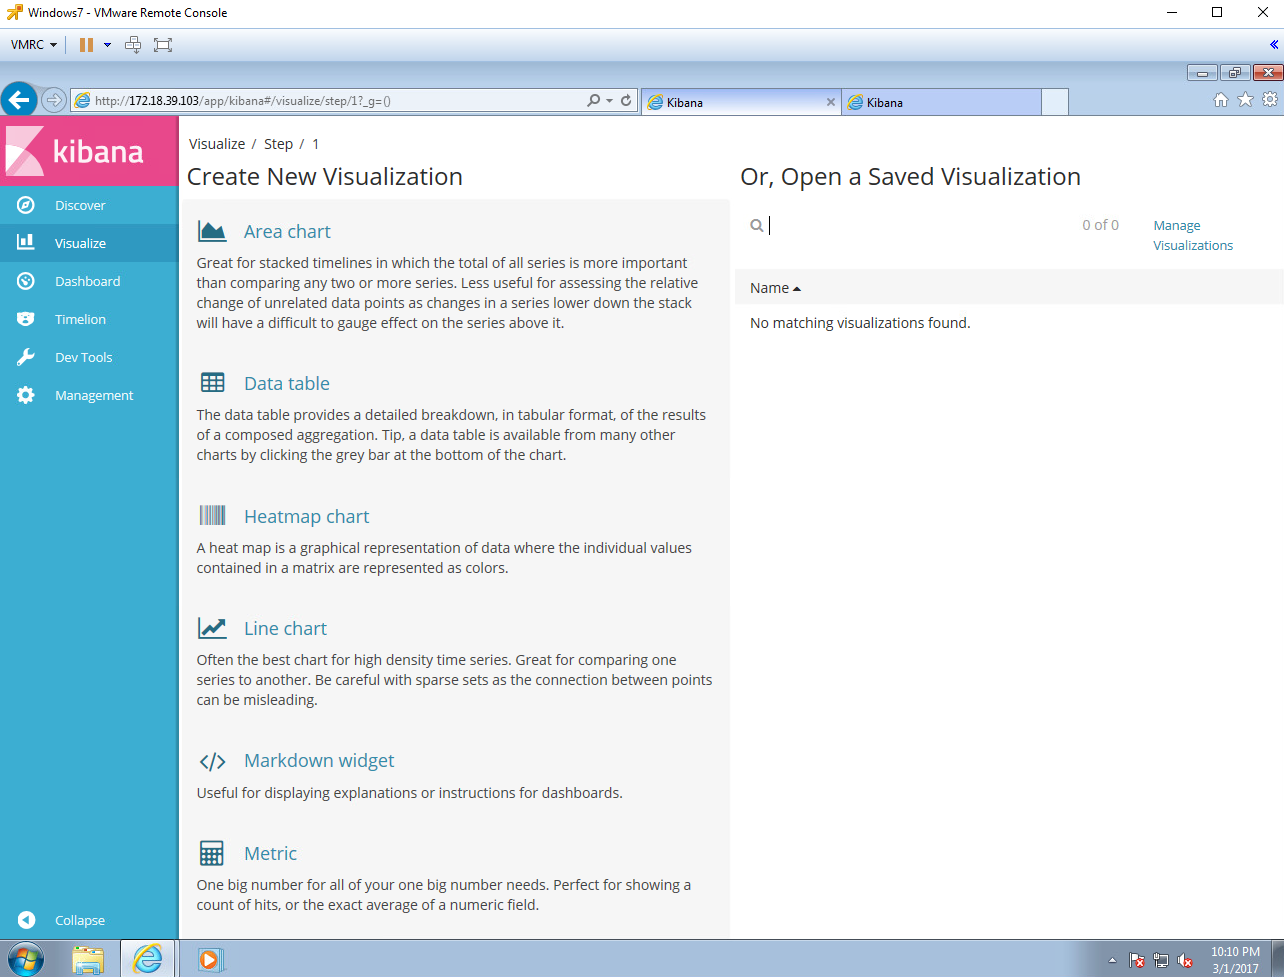
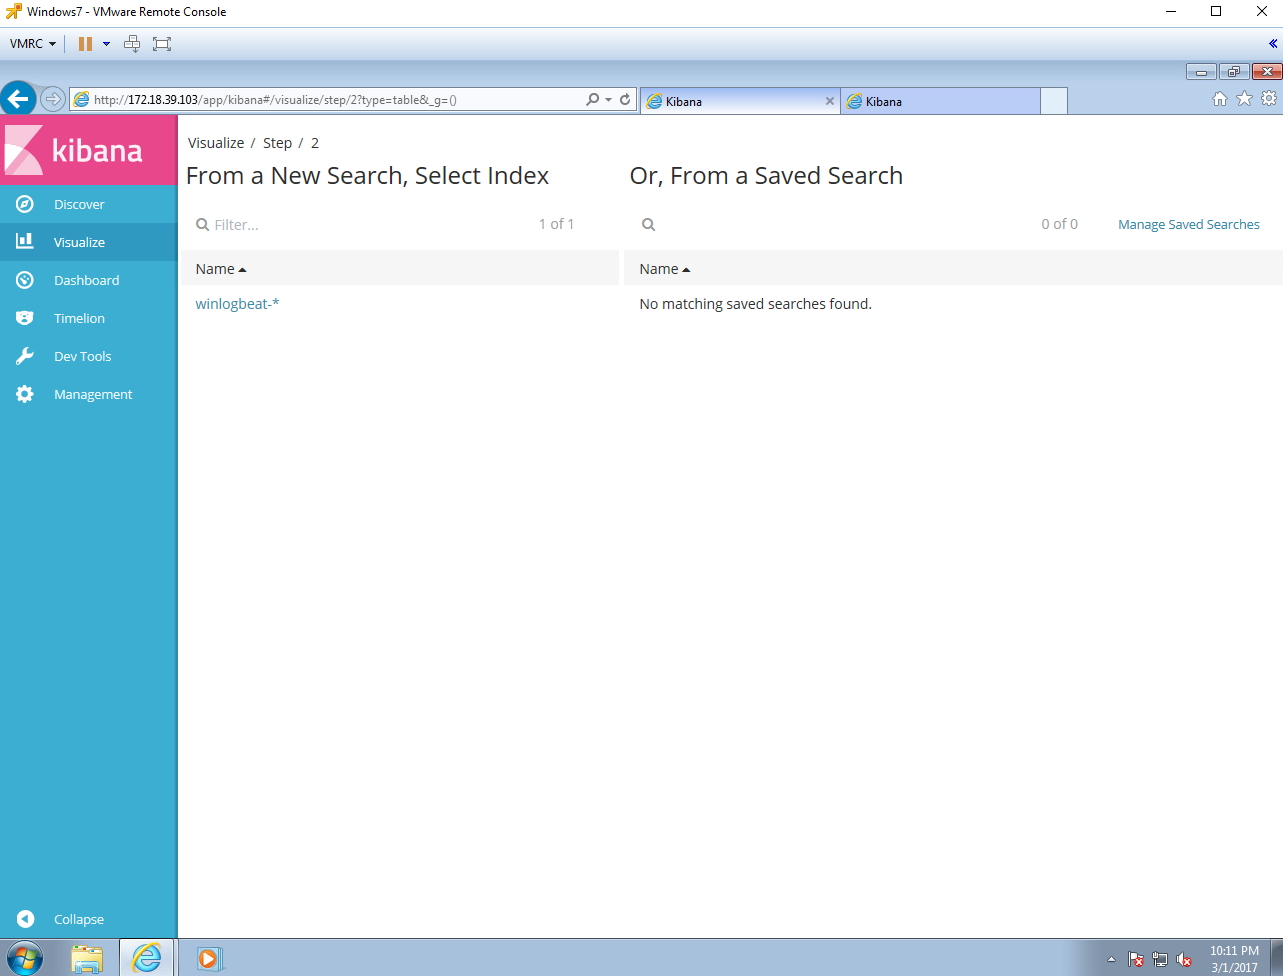
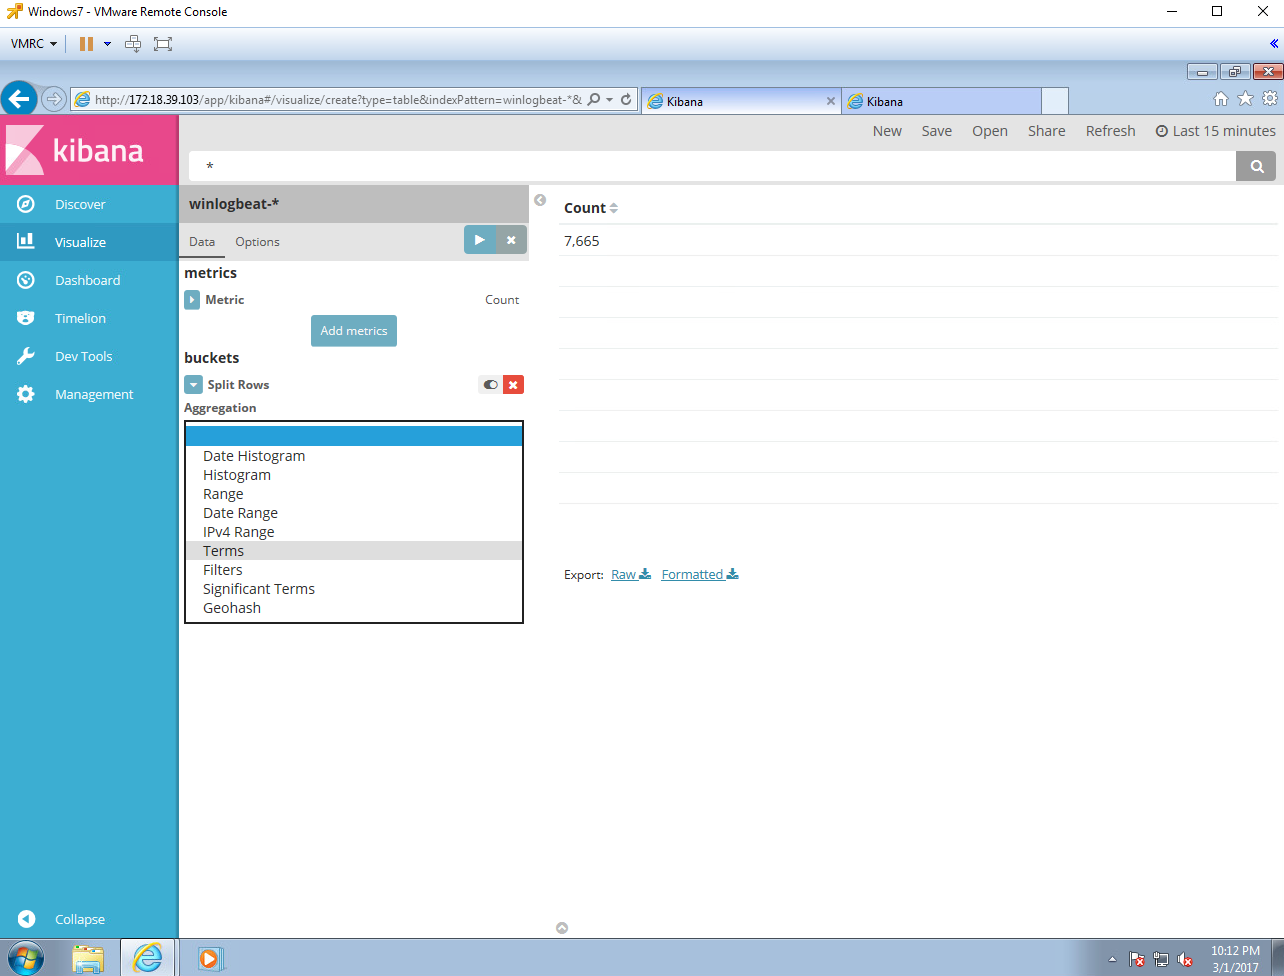
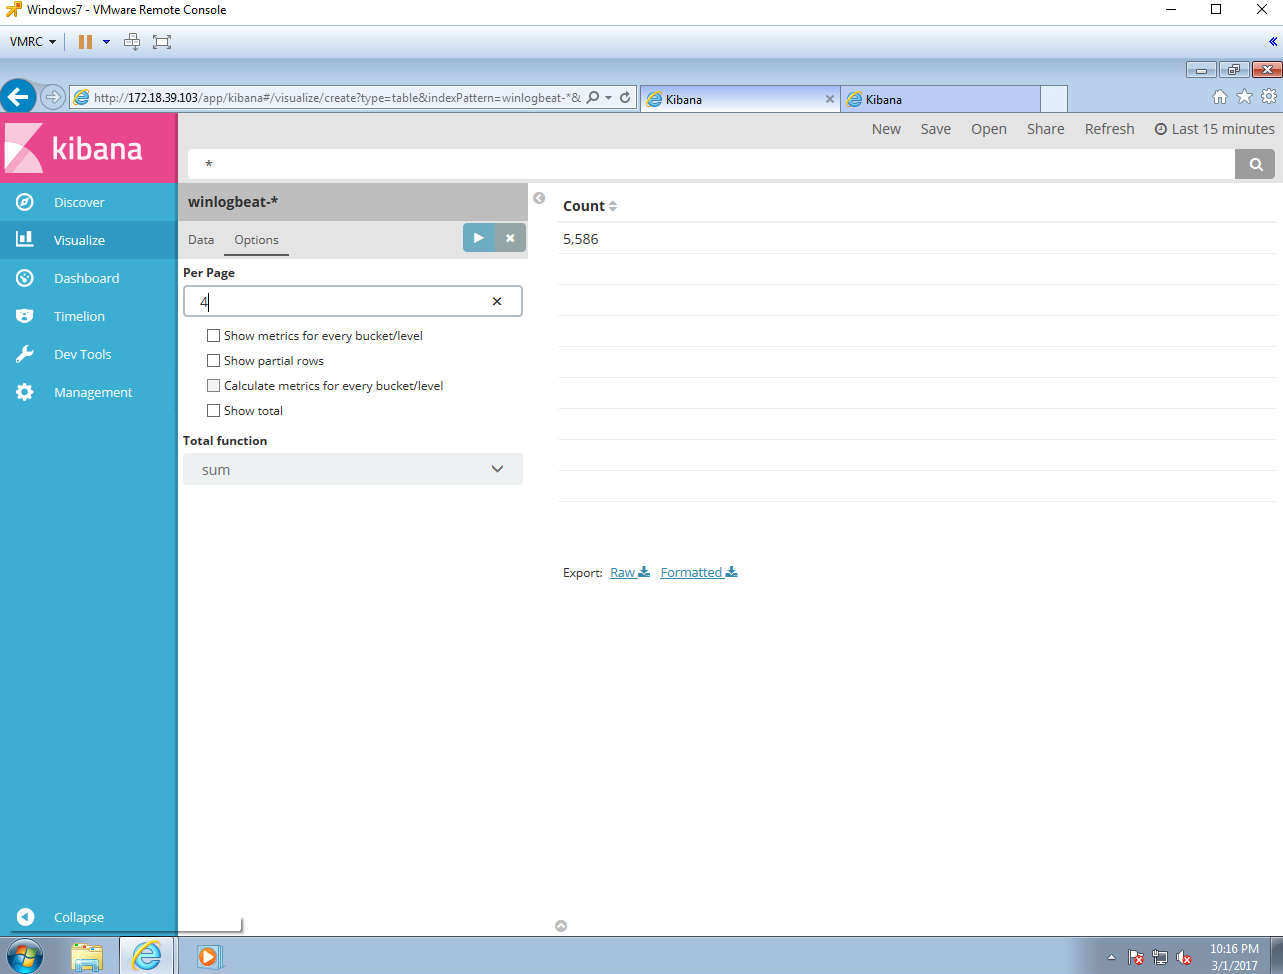
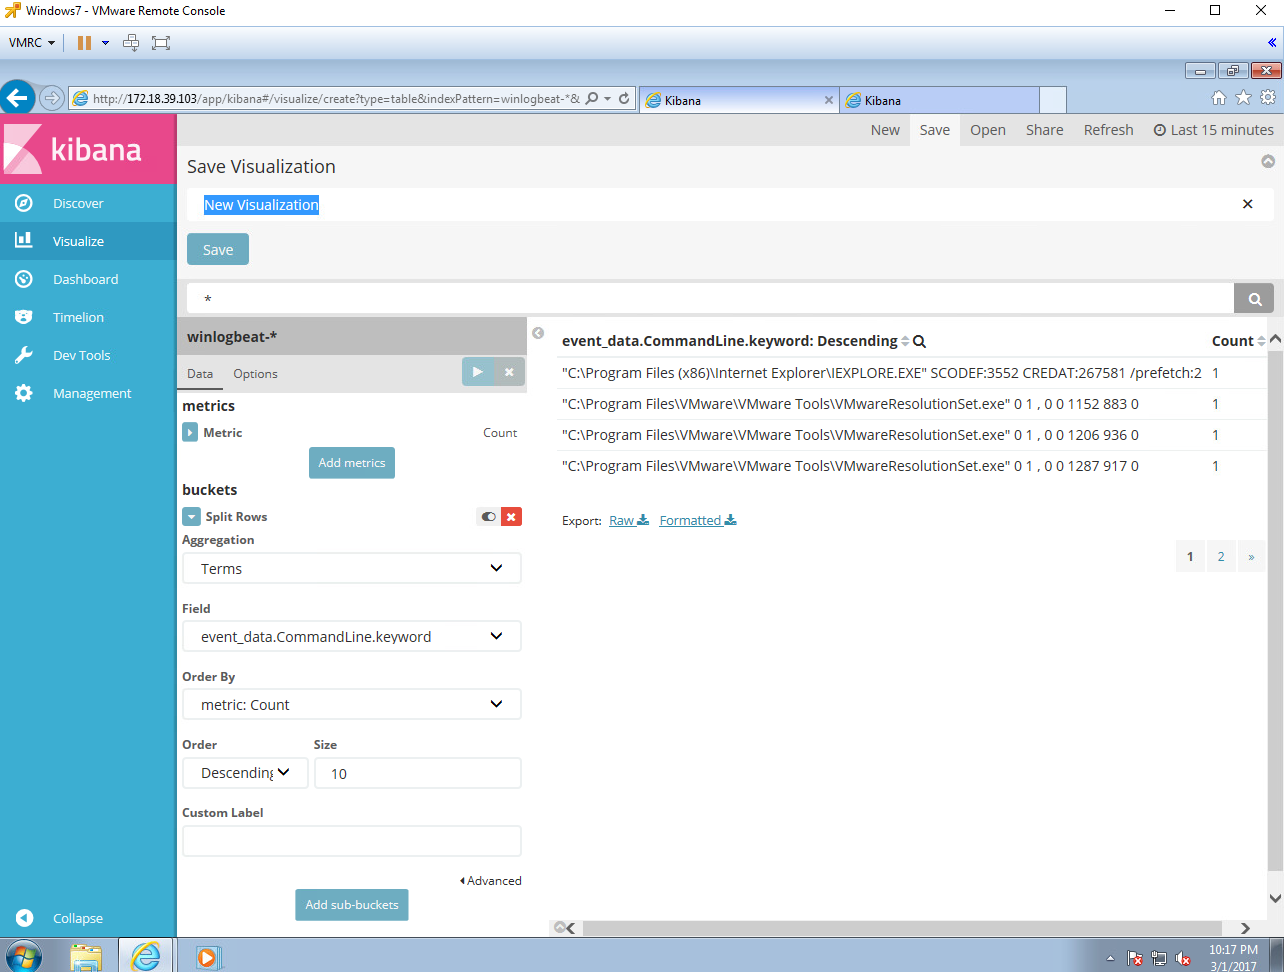
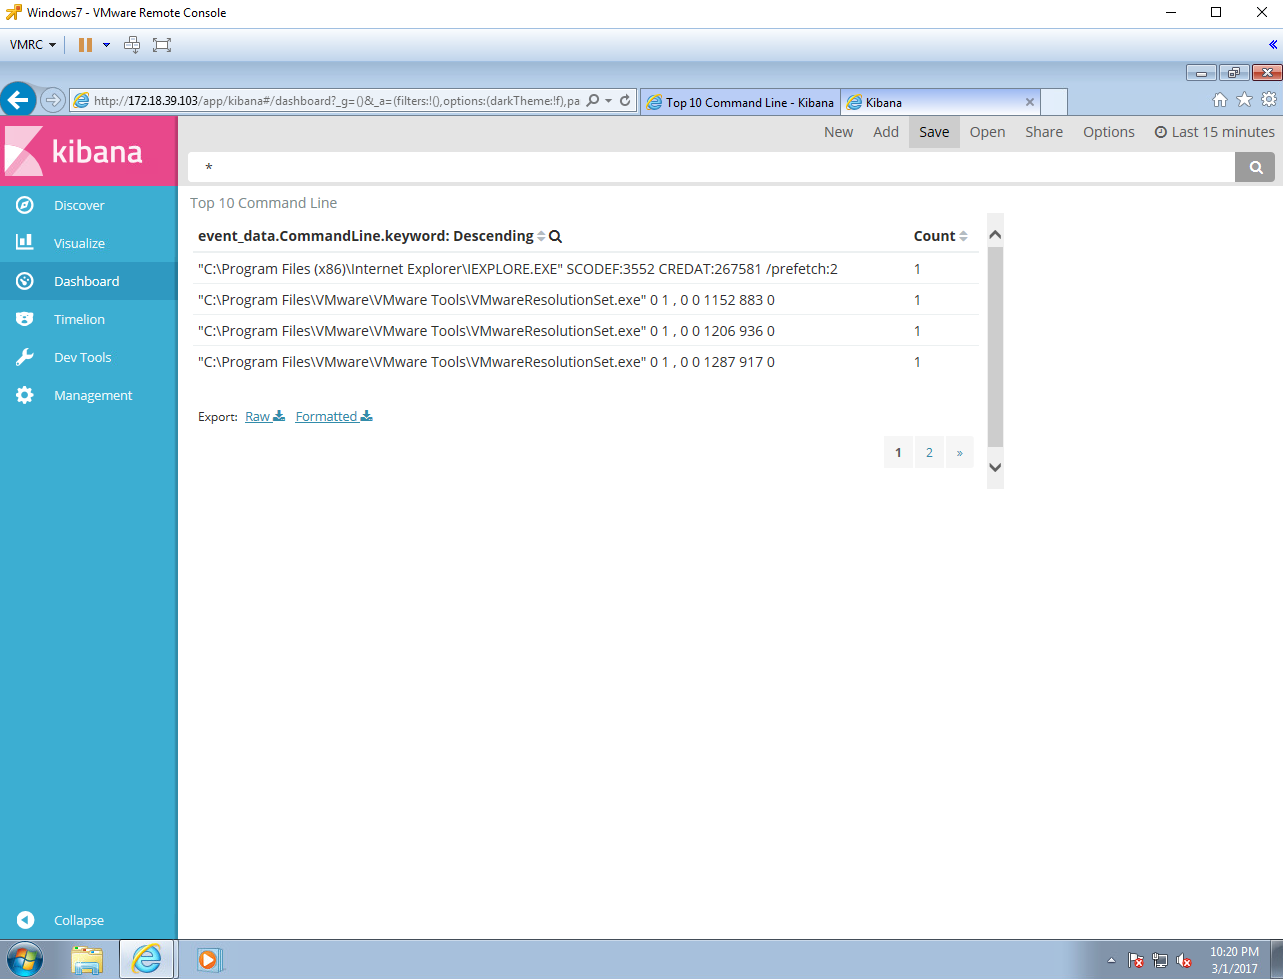
Getting a Kibana dashboard ready


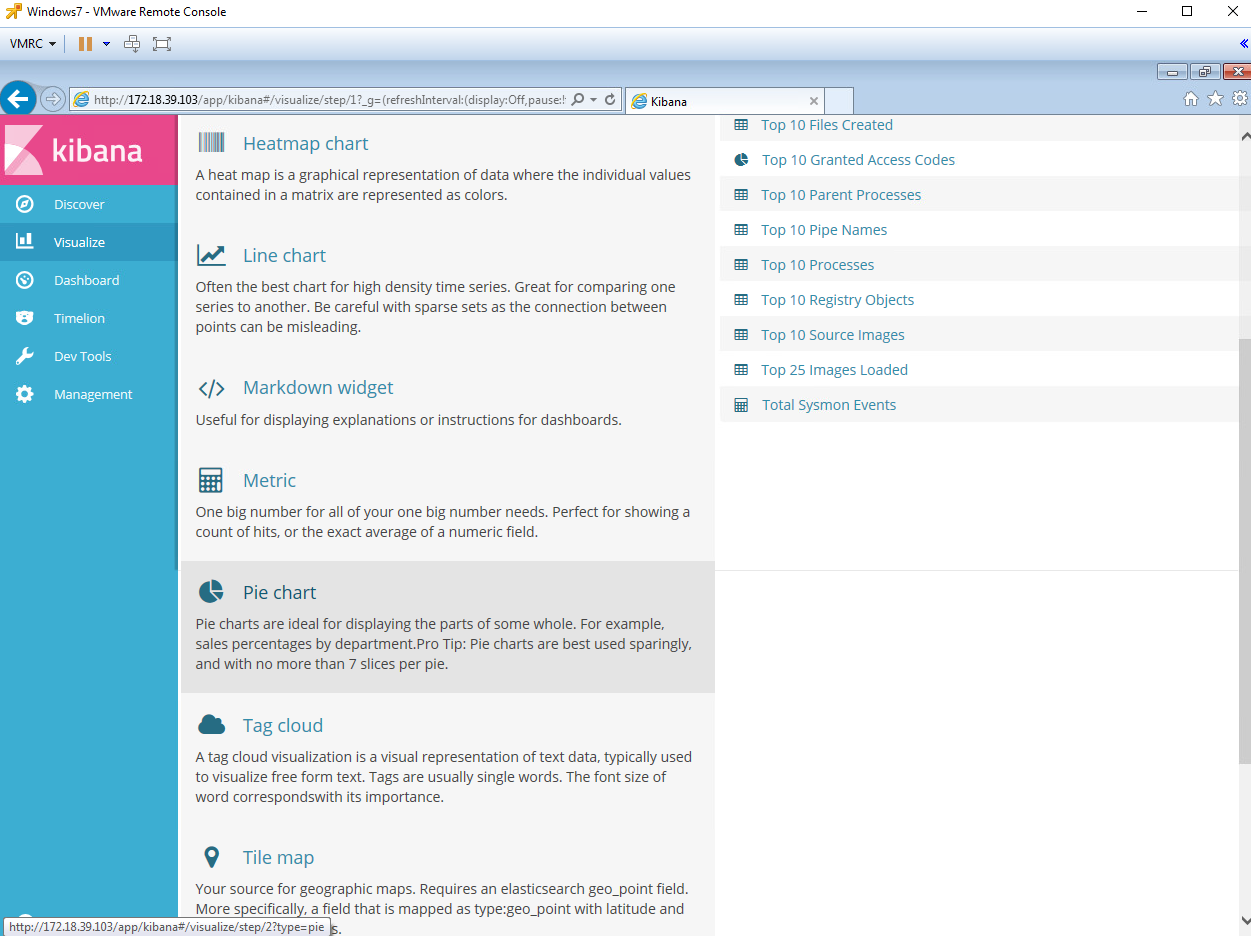
Instead of looking at all the Sysmon logs created in the event viewer console, I prefer to have all my logs in different visualizations on one dashboard. It makes the analysis way easier allowing me to look at all the data at once and filter out noise. If you want to learn the basics of how to build a Kibana dashboard, you can read about it here and here. Create one similar to the one shown in figure 1 below.


Figure 1. WMImplant Dashboard


Delete/Clean your Index 


In order to reduce the number of logs before and during executing WMImplant, make sure you delete/clear your Index by running the following command as shown in figure 2 below:

curl -XDELETE 'localhost:9200/[name of your index]?pretty'

Do this again a few seconds before you run WMIimplant against your compromised computer.


Figure 2. Deleting/Clearing Index


Hunting for WMImplant


Download WMImplant.ps1 and Run it on the Attackers VM


Download the script from here, and Import the functions to your Attackers VM. Then, run the main function Invoke-WMImplant to use it interactively as shown in figure 3 below.


Figure 3. Running WMImplant interactively.


Setting up a User to connect to remote systems


Let's say we have the password of a domain user and we want to use it to connect to his/her computer. Use the "Change_user" command as shown in figure 4 below.


Figure 4. Changing user to connect to remote systems.


Running Command Line commands: command_exec


Lets start with a basic command: whoami (make sure you delete/clear index seconds before executing this)


Figure 5. Running command_exec to execute whoami on remote system.


First Look at our Dashboard


Go to your dashboard and refresh it to show you what happened in the past 15 mins. Right away we can see a few things:

  • Pipes: 2 <Anonymous Pipe> (PowerShell.exe Anonymous Pipes all the time)
  • Parent Process: WmiPrvSe.exe
  • Parent Process: PowerShell.exe
  • Parent Command Line: powershell.(G`CM ('{1}e{0}'-f'x','i')) (L`S env:Osrv5).Value
  • Command Line: powershell.(G`CM ('{1}e{0}'-f'x','i')) (L`S env:Osrv5).Value


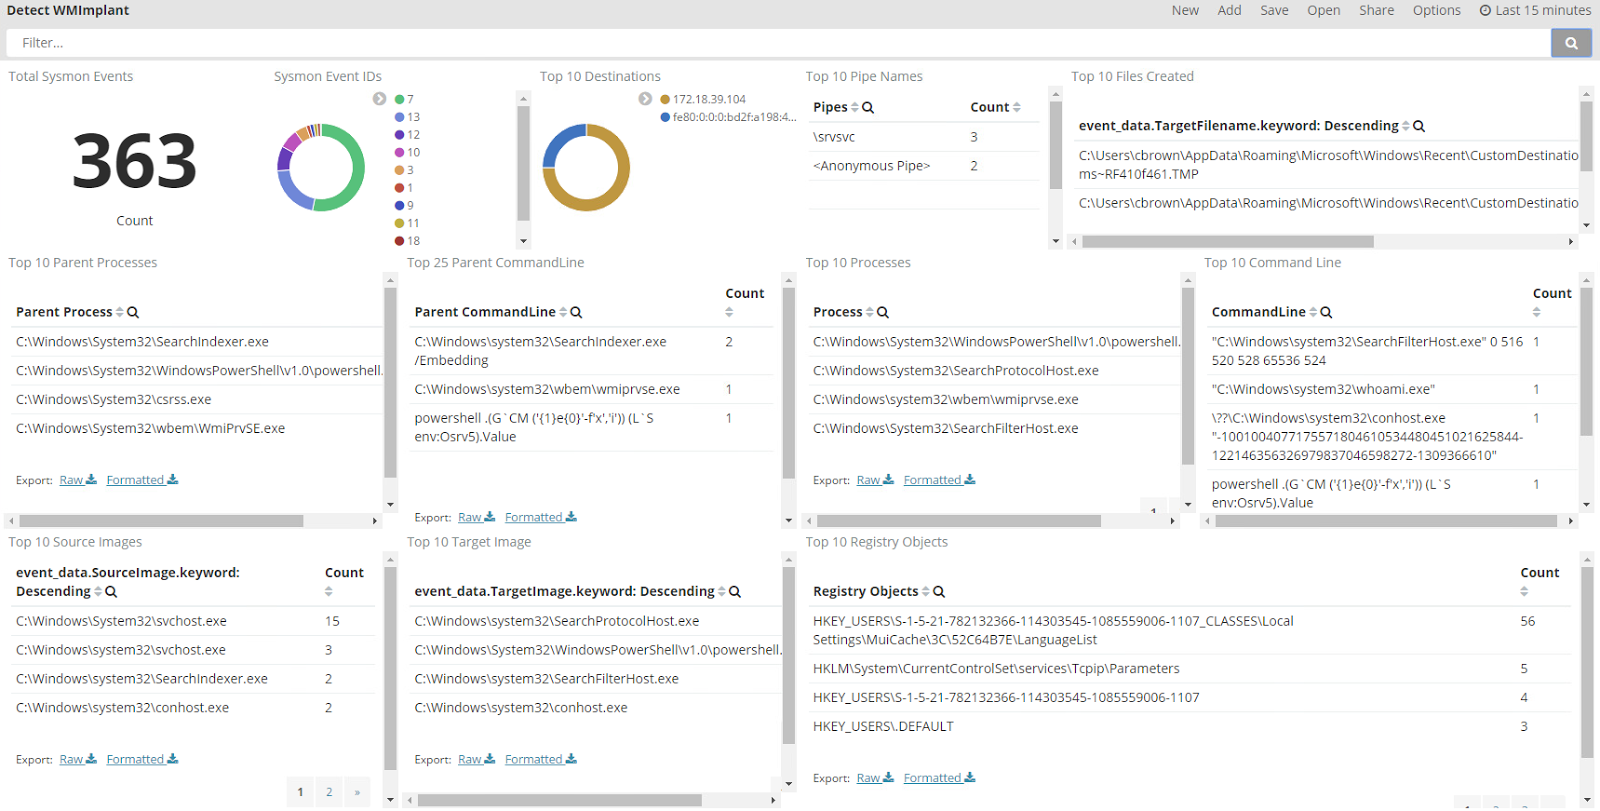
Figure 6. First glance at WMImplant


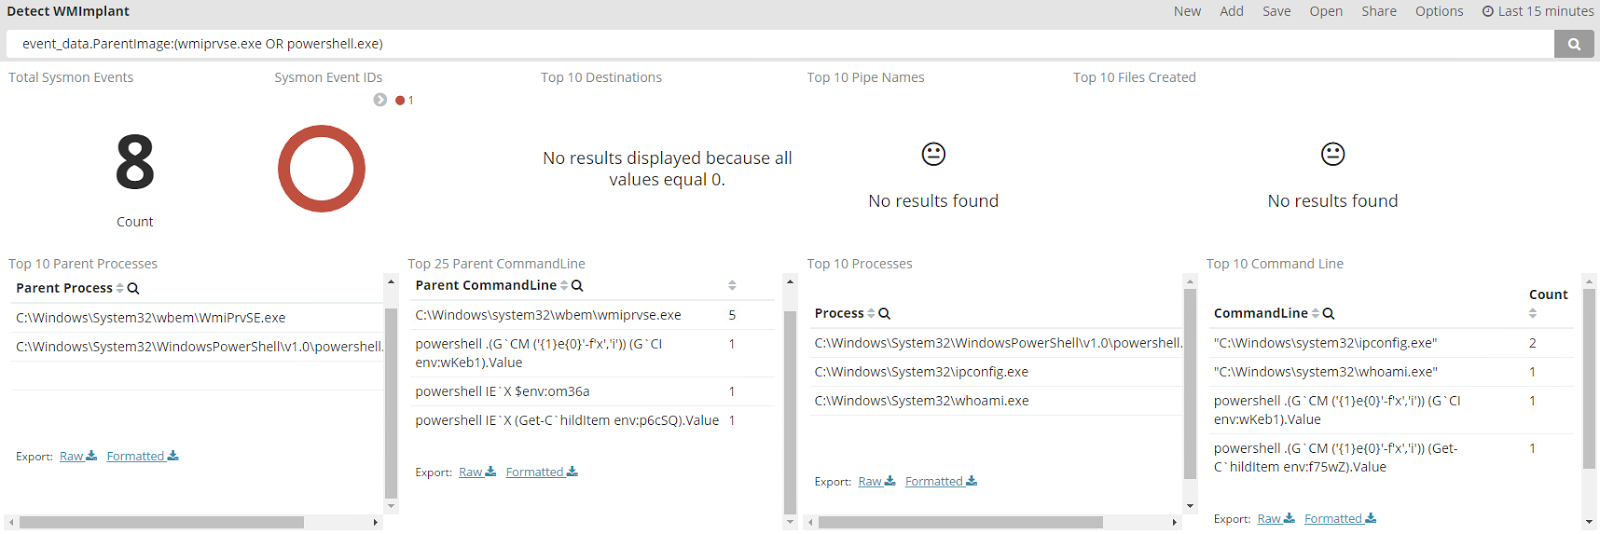
Next, filter all your events to show only events that have "wmiprvse.exe" and "PowerShell.exe" as parents to see how WMImplant interacts with the compromised computer while running commands. Lets do one at the time and then we can combine them in a Query to see them in a timeline style on Kibana's Discovery view as shown in figure 9 below


Figure 7. Filtering everything to show Wmiprvse.exe as a parent only.


Figure 8. Filtering everything to show PowerShell.exe as a parent only.


Figure 9. Discovery View looking for Wmiprvse.exe and PowerShell.exe as parents.


Checking WMImplant Methodology and Code


Command_exec apparently executes Invoke-CommandExecution which follows the same methodology as explained in its documentation:

  • Remotely query and obtain the original value for Win32_OSRecoveryConfiguration’s DebugFilePath property.
  • Use WMImplant to execute a command on the targeted system (such as ifconfig), encode the output, and store the encoded results in the DebugFilePath property.
  • Remotely query the targeted system’s DebugFilePath over WMI to receive the encoded results.
  • Decode the results and display them to the console.
  • Set the DebugFilePath property on the targeted system back to its original value.


I decided to look for the Win32_OSRecoveryConfiguration string and I found that it was being defined as part of a long command in a Registry Value as shown in figure 11 below.


Figure 10. Searching for Win32_OSRecoveryConfiguration.


Figure 11. Win32_OSRecoveryConfiguration in EID 13 (Setting Reg Value)


Running more commands: Ipconfig & Get-WmiObject


I decided to run two commands:

  • ipconfig
  • get-wmiobject win32_operatingsystem | select csname, @{LABEL='LastBootUpTime'; EXPRESSION={$_.ConverttoDateTime($_.lastbootuptime)}}


Figure 12. Running other commands.


Checking our Dashboard


We can see more of the same behavior in figures 13 and 14 below:


Figure 13. WMImpant execution.


Figure 14. WMImplant and Win32_OSRecoveryConfiguration fingerprint.


PowerShell Basic Obfuscation


We can see that there is obfuscation happening on PowerShell command. however, I see them all starting with "powershell" as you can see in figure 15 below. We could also look for :

  • 'Get-C`hildItem'
  • 'Get-C`ommand'
  • 'Inv`oke-Ex`pression'
  • 'IE`X'
  • 'G`CI'
  • 'env:'


Figure 15. Obfuscation.


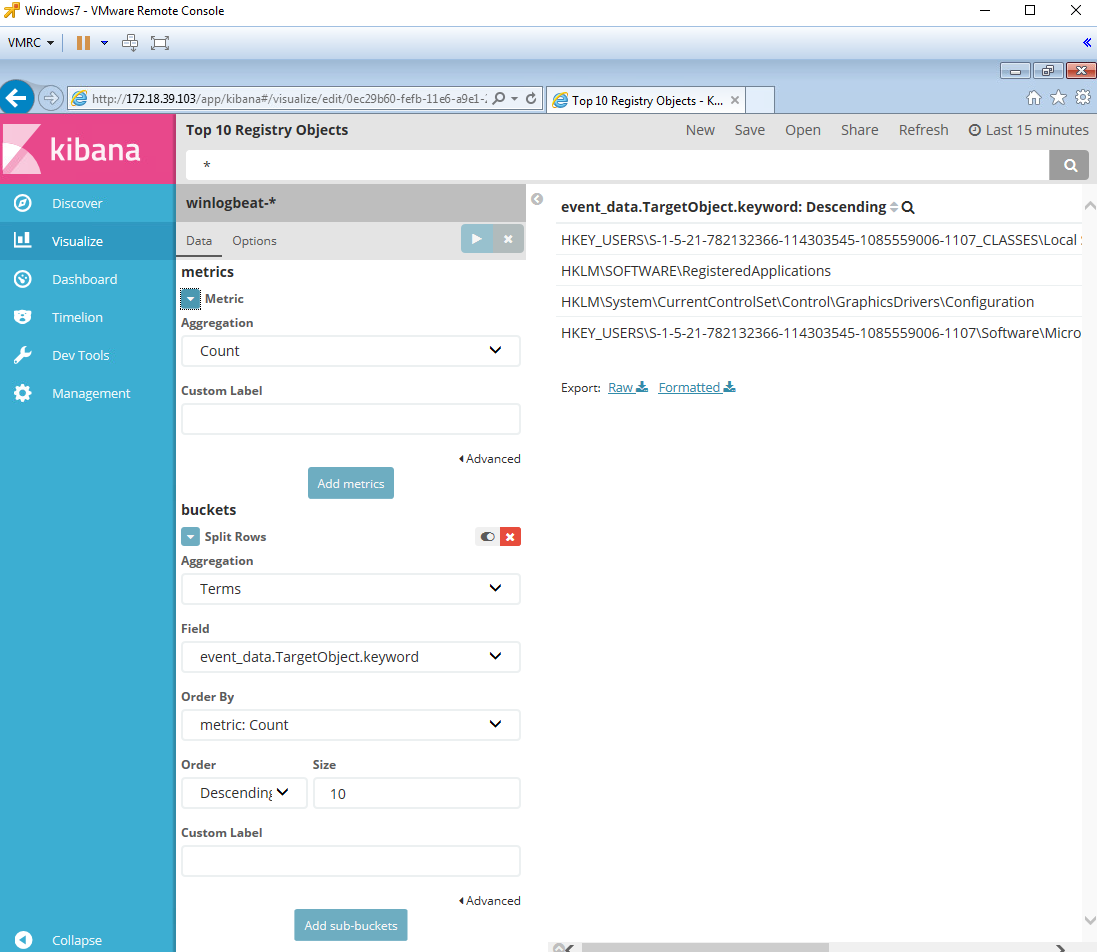
What is this "Environment\XXXXX"?


I noticed that the Registry Objects being set followed the same pattern:

HKEY_USERS\(user)\Environment\(5 characters)

Therefore I decided to filter everything by the string "Environment". I got results with Event IDs 12 and 13 as shown in figure 16 below.


Figure 16. Registry events WMImplant Fingerprint.


I decided to take a look at the code and found out that WMImplant creates an Environment variable with a 5 character Random alphanumeric name as shown in figure 17 below.


Figure 17. Environment Variable name created.


The Environment variable is set and then deleted which explains Sysmon Event IDs 12


Figure 18. Setting Environment Variable.


Figure 19. Deleting Environment Variable.


Final Thoughts


Even though this was just part I of hunting for WMImplant, I was able to come up with a basic fingerprint that could help us to reduce the number of false positives when hunting for WMImplant. I would say that the following fingerprint could be created based on the initial findings:
  • wmiprsve.exe spawning powershell.exe and executing obfuscated commands such as:
    • 'Get-C`hildItem'
    • 'Get-C`ommand'
    • 'DI`R'
    • 'L`S'
    • 'Child`Item'
    • 'Inv`oke-Ex`pression'
    • 'IE`X'
    • 'G`CI'
    • env:
    • 'Co`mmand'
  • Environment Variable name on EIDs 12 and 13
    • Pattern: \\Environment\\[a-zA-Z0-9]{5}
  • <Anonymous Pipes> by PowerShell.exe


Hunting Techniques recommended


Grouping [Source]
"Grouping consists of taking a set of multiple unique artifacts and identifying when multiple of them appear together based on certain criteria. The major difference between grouping and clustering is that in grouping your input is an explicit set of items that are each already of interest. Discovered groups within these items of interest may potentially represent a tool or a TTP that an attacker might be using. An important aspect of using this technique consists of determining the specific criteria used to group the items, such as events having occurred during a specific time window.This technique works best when you are hunting for multiple, related instances of unique artifacts, such as the case of isolating specific reconnaissance commands that were executed within a specific timeframe."


Searching [Source]
The simplest method of hunting, searching is querying data for specific artifacts and can be performed in most tools. Unfortunately it may not always be the most effective method because it cannot produce outliers in the result set; you get exactly the results you searched for.Searching also requires a finely defined search criteria to prevent result overload. A search that is too broad will often flood an analyst with too many results to realistically process.


You can either group those events or look for specific strings that get created under several events. You can configure your Sysmon config to monitor for environment variables and anonymous pipes. This was just part I. I will test the rest of the commands available next week and let you know what I find.


Feedback is greatly appreciated!  Thank you.


Friday, March 3, 2017

Building a Sysmon Dashboard with an ELK Stack


Threat Hunting is FINALLY a hot topic, and in the past couple of months the security community has been sharing amazing resources on how to hunt with the help of open source tools. One in particular that has got a lot of attention for endpoint visibility has been Sysmon, and with its latest capabilities added in version 6, hunting even for named pipe pivoting has become easier.

A few projects that I have read recently are awesome, and I highly recommend to take a look at them:


Some of the things that I love about most the projects out there are the different ways how sysmon configs are being put together and how data is being consolidated and presented for hunting campaigns. Therefore, in this post, I will show you how you can also create your own Sysmon dashboard but with the help of an ELK stack. This will help you to tune your initial Sysmon configurations and get a good overview of what you can see and hunt for in your lab. If you haven't yet read my previous series "Setting up a Pentesting... I mean, a Threat Hunting Lab", I recommend you to do it before continuing reading (At least, for the purpose of this post, read and follow the steps in Part 5 & Part 6 in order to be ready to build your dashboard). 


Current Kibana view


If you already have an ELK Stack running and Sysmon logs being forwarded to it, then picture 1 below will look very familiar to you. Even though this view allows you to start running a few queries to create chains of events and detect suspicious activity in your network, it does not give you a high overview of what is actually happening in your environment. I like to know my top events to filter out noise and detect the abnormal. Therefore, I will show you how you can create visualizations of specific events and add them to a dashboard.


Figure 1. Kibana default discover view.


Building a Sysmon Dashboard


Creating Visualizations


To get started click on the option "visualize" on the left panel. Next, you will have two options to choose from:

  • Create New Visualization - Showing different types that you can use to present your data
  • Open a Saved Visualization

Since this is our first visualization, then we will have to select the specific type we want to create. Make sure you review the Kibana User Guide - Creating a Visualization during this section to have a better understanding of each visualization type. 


Figure 2. Visualize options.


I like to use Data Tables because they are really flexible to show long strings of data and large number of events in a small graph. Data Tables  display the raw data of a composed aggregation. Click on Data Table to create one. 


Figure 3. Creating a Data Table.


We are creating all of our visualizations from scratch so select the index that you want to use for it. In my case, I selected my only index, winlogbeat-*.


Figure 4. Creating a Data Table. 


Next, you will get a plain visualization template which you will use to create your own one. One main thing that we need to do is select the data field that we want to use for this table, but first we will have to select a bucket type. The rows of the data table are called buckets. You can define buckets to split the table into rows or to split the table into additional tables [Source]. Select the Split Rows bucket type.  


Figure 5. Creating a Data Table.


Buckets support aggregations. Select the aggregations type "Terms". A terms aggregation enables you to specify the top or bottom n elements of a given field to display, ordered by count of a custom metric [Source]


Figure 6. Creating a Data Table. 


Next, select the field that you want to use for the visualization. For this first exercise, I chose the CommandLine field as shown in figure 8. One important thing to mention is that I use Keyword data fields (Keyword Analyzers) because it returns the entire string as a single token [Source]. For example, I chose event_data.CommandLine.keyword.


Figure 7. Creating a Data Table.


Figure 8. Creating a Data Table.


Then set the number of values that you want to show. The data by default will be ordered "Descending". You can set the size to 25 and it will show you the Top 25 values. Lets set it to 10 for this exercise.


Figure 9. Creating a Data Table. 


Figure 10. Creating a Data Table.


Next, you can also adjust the number of values you want to show per page. This will depend on how much space you want to use with your data table. I always set it to 4 to fit several data tables in one dashboard. 


Figure 11. Creating a Data Table.


Figure 12. Creating Data Table.


Apply the changes to your visualization by clicking on the blue triangle to the right of "options" as shown in figure 13 below. 


Figure 13. Creating a Data Table.


Now you will see events showing on the right side of your visualization console. Four values per page and two pages in the last 15 minutes. 


Figure 14. Creating a Data Table.


Save your visualization by clicking on the option Save. Give it a name and click Save. You will get a dark green confirmation message as shown in figure 18 below.


Figure 15. Saving Data Table.


Figure 16. Saving Data Table.


Figure 17. Saving Data Table.


Figure 18. Saving Data Table.


Creating a new Dashboard


Click Dashboard in the side navigation. If you haven’t previously viewed a dashboard, Kibana displays an empty dashboard [Source]. Click Add  in the menu bar to add your saved visualization to it.


Figure 19. Creating a Dashboard


As you can see, our Top 10 Command Line is the only one available. Click on it and it will get added to your Dashboard.


Figure 20. Creating a Dashboard.


Figure 21. Adding visualization to dashboard.


Next, you can start saving your dashboard with your first visualization by clicking on "Save". Give your dashboard a name and if you want to save it to open always with a specific time range, set the desired time range and click on the "Store time with dashboard" checkbox as shown in figure 26 below.


Figure 22. Saving new dashboard.


Figure 23. Saving new dashboard.


Figure 24. Saving a new dashboard.


Figure 25. Adjusting Time Range for new Dashboard.


Figure 26. Saving dashboard with option "Store time with dashboard".


Figure 27. Saving new dashboard. 


Creating a new visualization for our new dashboard


Let's create a different visualization. Lets select a Pie Chart.


Figure 28. Creating a Pie Chart.


  • Select the data field that you want to use in the visualization
  • Set the number of values to show in the data table
  • Apply Changes


Figure 29. Creating a Pie Chart.


As you can see, in figure 29 above, there is an event id (4656) that does not belong to the Sysmon ones. This is because I am also sending Windows event logs to my ELK stack. An easy fix is just to use the search bar and run a query to show only source_name:"Microsoft-Windows-Sysmon". That will make your visualization to work only with the results of your query which will be only Sysmon logs. 


Figure 30. Creating a Pie Chart.


Next, you can use the options button to change the shape of your graph. I always like to set it to the Donut style. Then, you can save your visualization and add it to your new dashboard the same way how we did it before with our Data table.


Figure 31. Creating a Pie Chart.


How can I exclude specific values in my visualization?


In figure 32 below, my top destination IP value is 172.18.39.103 and the problem with it is that the IP belongs to my own ELK server. Therefore, I need to filter that value out in my visualization. You have 2 options:

  • Add exclusions in your Sysmon Config (Recommended - Best Practice)
  • Create/Apply a filter to you visualization (good exercise for you)


Figure 32. Excluding values in visualization.


For the purpose of this exercise:

  • Click on the value you want to filter out, and it will actually set a filter to only show that value by default
  • Hover over the filter that you just created below the search bar
  • Select the (-) magnifier glass and you will see that the filter turns red which means that the value is now being filtered out


Figure 33. Excluding values in visualization.


Figure 34. Excluding values in visualization.


Figure 35. Excluding values in visualization.


Creating all the needed visualization for our Sysmon Dashboard


Total Sysmon Events - Metric Visualization


By selecting winlogbeat-* index, the Metric Visualization will count all the events in our index. Make sure that if you want only Sysmon logs, you run a query for source_name:"Microsoft-Windows-Sysmon" as shown in figure 36 below.


Figure 36. Sysmon Metrics.


Sysmon Event IDs - Pie Chart Visualization


Figure 37. Sysmon Event IDs.


Registry Event Types - Pie Chart Visualization


Figure 38. Registry Event Types..


Top 10 Granted Access Codes - Pie Chart Visualization 


Figure 39. Granted Access Codes.


Top 10 Destinations -  
Pie Chart Visualization 


Figure 40. Destination IPs.


Top 10 Destination Ports -  Pie Chart Visualization 


Figure 41. Destination Ports.


Top 10 Parent Processes - Data Table Visualization


Figure 42. Parent Processes.


Top 10 Processes - Data Table Visualization


Figure 43. Processes.


Top 10 Command Line - Data Table Visualization


Figure 44. Command Line.


Top 10 Pipe names - Data Table Visualization


Figure 45. Pipe Names.


Top 10 Source Images - Data Table Visualization


Figure 46. Source Images.


Top 25 Images loaded - Data Table Visualization


Figure 47. Images Loaded.


Top 10 Registry Objects - Data Table Visualization


Figure 48. Registry Objects.


Top 10 Files Created - Data Table Visualization


Figure 49. Files Created.


How do I delete visualizations?


  • In the dashboard console click Add and select the option "Manage Visualizations"
  • Click on the checkbox of the visualization as shown in figure 51
  • Select the option "Delete"
  • Confirm that you are deleting the visualization 


Figure 50. Add visualizations console.


Figure 51. Selecting the visualization.


Figure 52. Deleting visualization - Confirmation.


Figure 53. Visualizations.


All the visualizations needed for our Sysmon Dashboard


Figure 54. Visualizations ready.


Saved visualizations added to our Sysmon Dashboard


Figure 55. Sysmon Dashboard.


How do I clean my dashboard or Index?


Stop your Winlogbeat services on your endpoints to stop them from sending logs to your ELK server.


Figure 56. Stopping Winlogbeat service.


On your ELK server delete your index by using the following command:

curl -XDELETE 'localhost:9200/winlogbeat-*?pretty'

https://www.elastic.co/guide/en/elasticsearch/reference/current/indices-delete-index.html 


Figure 57. Deleting Index. .


Refresh your discover view and you dashboard. You will see that there are no records available.


Figure 58. Clean Index.


Figure 59. Clean Dashboard.


Start sending logs back to your ELK Stack


Start your winlogbeat service on your endpoints and refresh your Discover view and Dashboard.


Figure 60. Starting Winlogbeat service.


Figure 61. Discover view.


Final Sysmon Dashboard


Figure 57. Final Sysmon Dashboard.


That's it! In my next posts I will be using the same approach to start creating targeted dashboard hunts for different TTPs. 


Feedback is greatly appreciated!  Thank you.